Nothing says festive season like graphs. Welcome to ‘my year in reading, unnecessarily graphed’.
This year I started 104 books. I gave up on seven of them; two of them I’ve been reading for months, but I still intend to finish them.
Ten of them were required reading: five were manuscripts from other writers, and five were books I had to read for an essay on animals.
At the beginning of the year I claimed I would read no books by white Australian authors published after 1997, unless the book was by a friend (I was trying to diversify my reading). Either I have a lot of friends, or I just totally failed at that. I also wanted to read more books by writers of colour (which I did: 27 in total) and books in translation (I managed 11).
Now let’s take a look at those graphs.
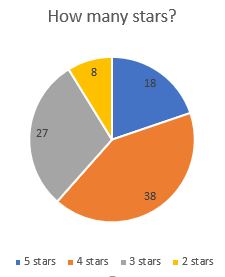
That’s a good year in reading. The vast majority of books I read I liked a lot. It’s making my ‘best books of the year’ post very difficult, which is why I haven’t done it.
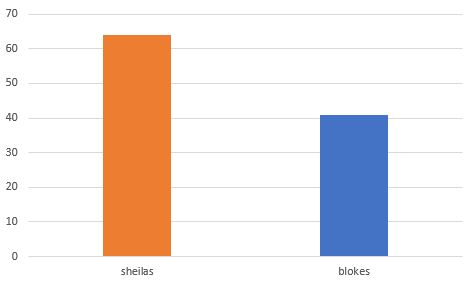
Female writers have definitely become my default, maybe because so many contemporary Australian books are written by women, and I tend to read a lot of those books (despite my vow above).
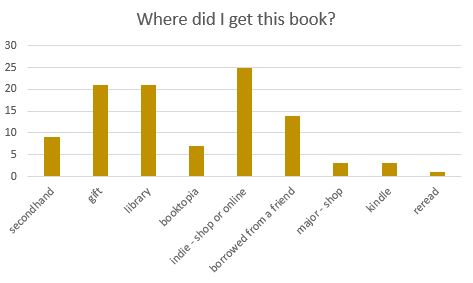
Sorry about all those lost royalties, authors. Thanks, Savers Footscray, for keeping my bookshelves stocked, to my friends (I’m looking at you, Justine) who lend me books and to those publishers who every now and again pop a copy of a new release in the post for me. This year I’ve been buying more books direct from indie publishers, particularly in the UK, and reducing my Booktopia bill a bit. As always, Footscray library is the total best.
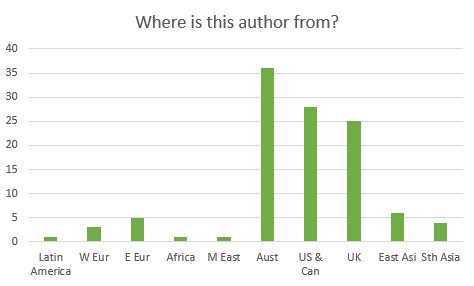
Comparing some apples and oranges there to make my reading look more diverse. It still looks totally not diverse. Wow I read a lot of books from three places.

So much for not reading as many ‘must-read new releases’. Let’s have a closer look at those stats though: why so many books from 2011? Who knows: they were Swamplandia, Adelaide, Zone One, The Cat’s Table, The Monsoon Bride, End of the Night Girl, Trieste and The Night Circus (E. Morgenstern version). For what it’s worth, The Cat’s Table, Zone One and Trieste were among my favourite books of the year. Maybe I’ll only read books published in 2011 next year.
Other random stats: I meant to read more poetry this year, but only read two books: Rachael Mead’s The flaw in the pattern (which is great) and Han Kang’s The white book, which isn’t even technically poetry. And most of the books I read fell into one (or all) of these categories: ‘about the environment’, ‘historical’, ‘speculative fiction’.
In summary, reading is still the best. Maybe I should start graphing everything I do and giving it a star rating. Reading will win by miles.
Andy Maurer
December 20, 2018 at 2:14 pmnice post rawson
(i love graphs)
any chance of a venn diagram next year?
Jane Bryony Rawson
December 20, 2018 at 3:11 pmI’ll have to find out if Excel knows how to Venn, because there are definitely some interesting intersections in there.
Angela Savage
December 21, 2018 at 8:14 amLove this idea, Jane. May steal it…
Jane Bryony Rawson
December 21, 2018 at 8:35 amAnge, I’m going to steal this spreadsheet next year – maybe you should too https://bookriot.com/2018/12/17/2019-book-tracking-spreadsheet/
Angela Savage
December 29, 2018 at 9:41 amWOW, that is a thing of beauty…
Kat Clay
December 24, 2018 at 5:31 pmI always really enjoy your year of reading in graphs! I found I read a lot more female writers this year, and I was happy with that. And yes, Footscray savers is the best – I’ve picked up a few good ones there including a first edition of the Blind Assassin.